The UK Meteor Radar Project
(Updated 26 July 2025)
This document is availabe as a download from here
This is a citizen science project supported by the Radio Society of Great Britain, the British Astronomical Association and by the Mansfield and Sutton Astronomical Association who host the project transmitter at their Sherwood observatory in Nottinghamshire. Together with a network of receivers around the country this forms a bi-static radar system to study meteors and other radio reflecting events above the UK. The radio echoes can be viewed live at:- Receiver Live Streams. Everyone is welcome to use this resource to study meteors and the project hardware and software are “open source”.
Using the “Live” Display.
Radio echoes can conveniently be displayed on a “Waterfall display”. See Fig 1. The vertical axis is time flowing down the screen, hence the name “waterfall”. From top to bottom represents about one minute on the live display screens. The horizontal axis is frequency in Hz. Knowing the frequency of the echo is useful because it is Doppler shifted due to the high velocity and rapidly changing length of path from transmitter to meteor and on to the receiver.
Fig 2 is a screenshot of the live display. It shows a number of “head echoes” from the receivers in the network. The faint vertical lines precisely at the centre are direct signals from the beacon and vary with radio propagation conditions. The near vertical, slightly curving lines, are aircraft echoes. The meteor “head echoes”, the near horizontal traces in Fig 2 have no “Tail echoes”.
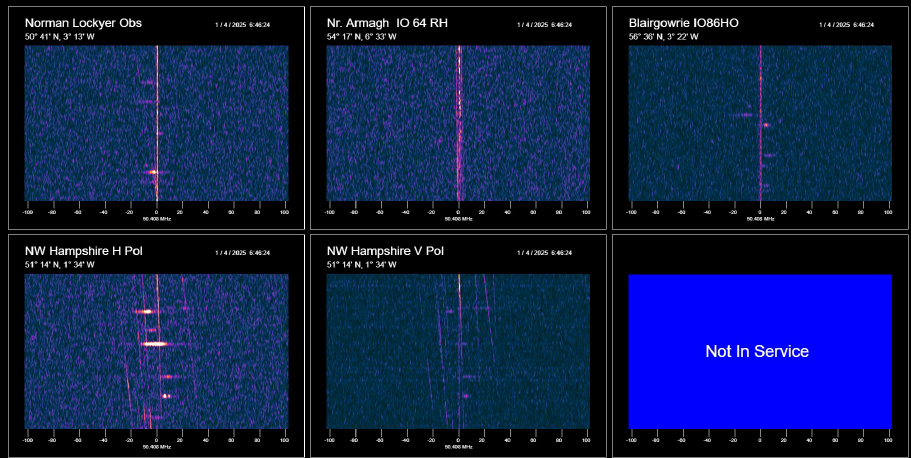
Fig 2
Currently there are 5 receivers in the network at five different locations, see Fig 3. The beacon transmitter is located at the Sherwood Observatory near Mansfield Nottinghamshire, and illuminates a region with a diameter of more than 400km centred on the observatory.
Observing meteors
The rate at which the system detects meteors averages at about two per minute. Most of these are very small, no bigger than grains of sand. But occasionally we see much bigger meteorites.
The best time to look for meteors is in the first part of the day from 00:00 to 12:00 local time when our location on the planet faces towards its' direction of travel in its' orbit around the sun and collisions with dust and rocks in space occur most frequently. Regular showers occur when the Earth passes through trails of dust left behind by comets and asteroids. The rate of observation of meteors might rise considerably when this happens. There are various on-line calendars giving the dates of the regular meteor showers. Meteor Shower Calendar.
Things to look out for when using the “Live” stream displays are brightness, Echo Radio Frequency and Doppler Shift using the horizontal scale. Note also the duration, spectral spread and frequency / Doppler shift of the tail echo when present.
Recognising meteors and other echoes
Meteor echoes are detectable to the radio horizon from the altitude where they create ionisation ( 80 to 100km) a distance of around 1200km. Echoes from aircraft flying at 10,000m are detectable to a distance of about 250km.
So receivers within about 400km of the transmitter will see aircraft echoes. These appear as near vertical, slightly curving lines such as those in Fig 4 which also shows a small meteor head echo, the bright near horizontal trace. The curvature of the aircraft echo displayed on the waterfall is due to its changing Doppler shift.
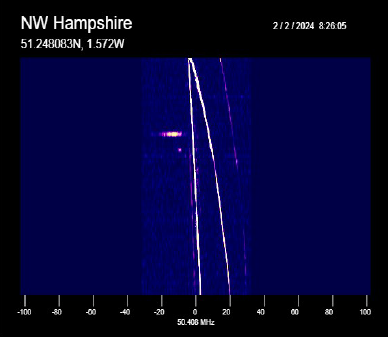
Fig 4
While the beacon transmitter beams vertically up, some energy travels horizontally to sometimes produce a “direct” signal at some receivers. On the Waterfall this will appear as a vertical line precisely on the beacon frequency of 50.408MHz. Fig 5
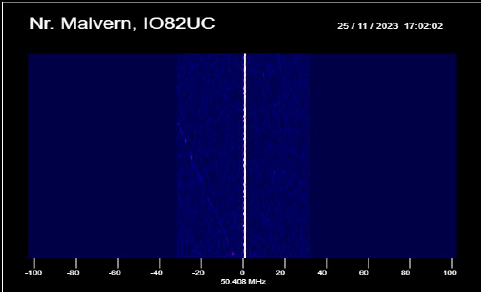
Fig 5
Sometimes two aircraft echoes or an aircraft echo and a direct signal will “beat” together to produce a pulsating effect. See Fig 6. This is known as aircraft flutter in communications terms and is not of interest to us when observing meteors or other events in the ionosphere.
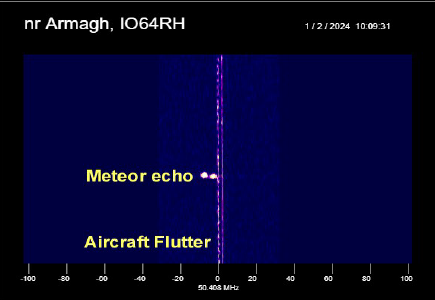
Fig 6
To comply with its OFCOM licence requirements the beacon has to send its call sign GB3MBA every few minutes. It does this with high speed Morse code using A1A keying. If a strong direct signal or aircraft reflection is present this can produce a trace like that in Fig 7. This is not a meteor echo. These are known as key clicks. Ideally they would not be present. The systems' high resolution of frequency shows this modulation as expected.
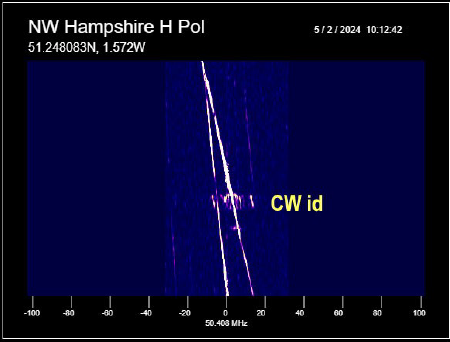
Fig 7
Interference
Interference is the bane of all radio astronomers. We have tried to select radio quiet locations for our receivers. But cannot avoid all interference. Sometimes interference comes in bursts see Fig 8. The source could be man made or from lightning within a few hundred km. If you see single or multiple lines with more or less rapidly changing frequency they are likely to be from poorly designed electronic equipment nearby.
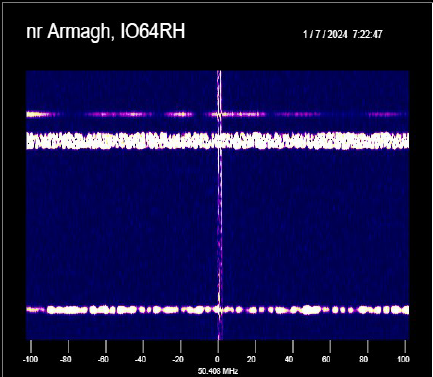
Fig 8
Other reflecting events in the ionosphere
Other phenomena including solar radiation, wind shear etc. can produce radio reflecting events in the ionosphere. Sporadic E and Aurora are examples.
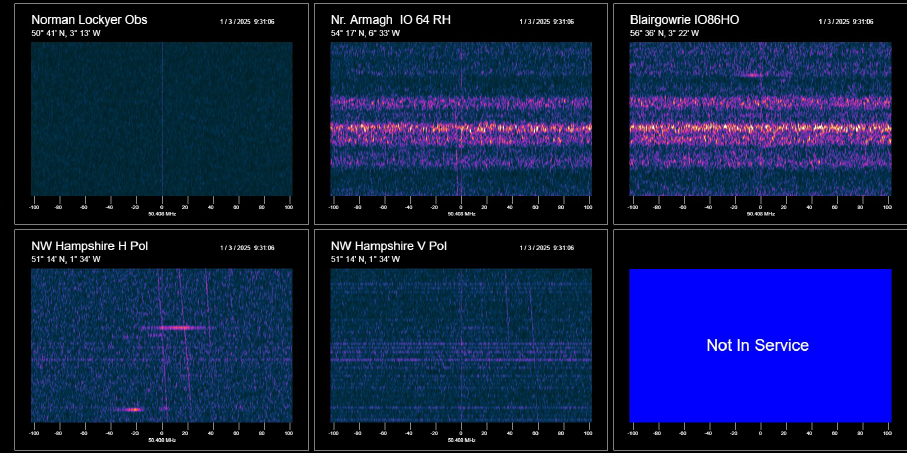
Fig 9
Fig 9 shows a reflecting event with very broad spectral spreading. If this had been
detected by only one receiver we could safely assume it to be interference. But as two
receivers have seen the same signal this strongly suggests that this has a natural cause.
Sometimes we see such echoes from all five receiver locations.
Meteor Head echo Doppler
For the purposes of understanding head echo Doppler shift consider the meteor as a point source moving along it's trajectory but only being reflective to radio while its in the bold dotted red regions shown in Fig11 where ionisation is strong enough to support reflection of radio. In all cases the reflection path length is changing and the meteor is decelerating due to friction. Fig 10 is a simplified plan view in 2D. Altitude is not shown or implied .
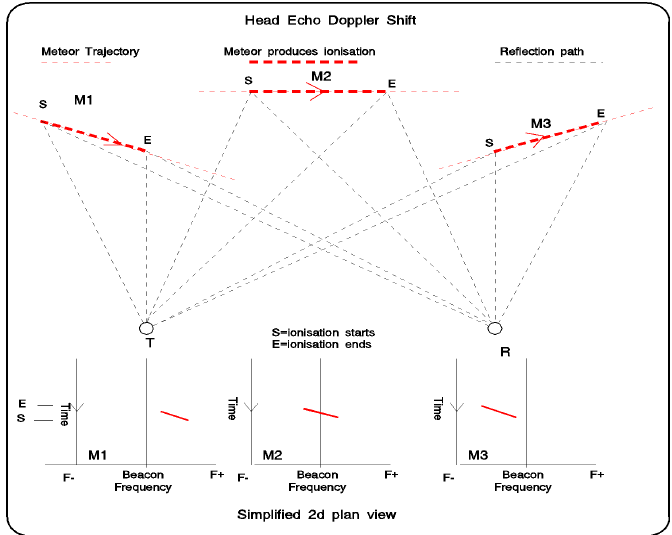
Fig 10
In the case of meteor M2 ionisation starts while the reflection path length is reducing and ends with the path length increasing. So the Doppler starts positive at S, passes through zero and ends at E, negative . In the case of meteor M3, the path length from transmitter T to M3 and on to the receiver at R is increasing at S so the Doppler will be negative and increases towards the end of the ionisation E so the Doppler starts negative and becomes more negative. So although the slopes observed from different receivers in the network will vary, in all cases the slope of the head echoes will be from lower right towards upper left on the waterfall. Raw data from the receivers being is recorded for analysis in the future. This will enable the slopes to be studied in detail while embedded timing data will enable correlation of observations from the different receivers.
More on Tail echoes
Tail echoes occur when relatively static regions of the ionosphere become sufficiently ionised to reflect radio due to the passage of the meteor and remain ionised for a time after the meteor has passed through it. Tail echoes do not always form but when they do they can last for tens of seconds and sometimes longer. At the altitude where meteors burn up creating the head echo the Ionosphere is already more or less ionised .. the clue is in the name. But until triggered by the passage of a meteor or other events which may include wind shear, the electron density is not sufficient to reflect radio. As these ionised regions are relatively static in the ionosphere the reflections exhibit relatively little Doppler shift and what there is is due to the ionisation drifting in the wind. Meteorologists use this to measure wind speeds at this altitude which is too high for balloons, too low for satellites and too expensive to reach frequently with rockets !
Fig 11 shows a head echo followed by a tail lasting a few seconds. While Fig 12 has no obvious head echo but the clearly defined straight, sloping bottom of the trace suggests a head echo. Observations have shown that head echoes are highly directional at the 6m wavelength. This is due to the ionisation causing them being cylindrical, even wire like with a diameter smaller than a half wavelength. Observations using cross polarised antennas demonstrate that tail echoes can sometimes be linearly polarised too. In Fig 13 the tail echo lasts more than 30 seconds. Note the wide spectral spread / range of Doppler shifts, suggesting the ionised region encompasses a range of wind speeds. Wind shear adding to the electron density ? Tail echoes viewed with this high resolution can be spectacular and have weird shapes that need explanation.
Exotic Echoes
From time to time you will see strange shaped echoes such as those in Fig 13 . Like head echoes these are sometimes directional and polarised. Maybe we can learn something of the state of the ionosphere from such echoes?
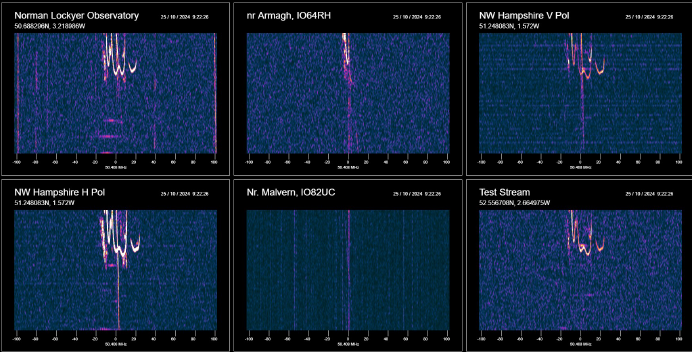
Fig 13 Some unusually shaped "Tail Echoes"
More examples of these exotic echoes can be found on the project web site here
The future
We are now able to record the full bandwidth data from all the receivers in the network. At a sample rate of 7812.5 Samples per second and including precision timing data this allows correlation of observations from the different receiver locations with a precision of about 130uS. The recording archive can be found here
We are developing tools to allow users of the recorded data to scroll through the data to examine events of particular interest. We are also working on automated capture and analysis of events of interest.
If you would like to contribute to this work please make contact with the group Contact Us
(Updated 26 July 2025)
This document is availabe as a download from here
This is a citizen science project supported by the Radio Society of Great Britain, the British Astronomical Association and by the Mansfield and Sutton Astronomical Association who host the project transmitter at their Sherwood observatory in Nottinghamshire. Together with a network of receivers around the country this forms a bi-static radar system to study meteors and other radio reflecting events above the UK. The radio echoes can be viewed live at:- Receiver Live Streams. Everyone is welcome to use this resource to study meteors and the project hardware and software are “open source”.
Using the “Live” Display.
Radio echoes can conveniently be displayed on a “Waterfall display”. See Fig 1. The vertical axis is time flowing down the screen, hence the name “waterfall”. From top to bottom represents about one minute on the live display screens. The horizontal axis is frequency in Hz. Knowing the frequency of the echo is useful because it is Doppler shifted due to the high velocity and rapidly changing length of path from transmitter to meteor and on to the receiver.
| The strength of the echo is represented by brightness. While the meteor is moving at speeds of more than 10km per second through the atmosphere it heats up due to friction and creates a short column of electrons behind it ( ionisation or plasma ). This acts like a wire and reflects incident radio waves supplied by the projects' beacon transmitter. This fast moving reflector produces the “head Echo” which is very short lived, of the order of 100mS or less. It is represented on the waterfall display by a near horizontal line. This corresponds to the very brief “shooting stars” we sometimes see on a clear night. Sometimes material ablated from the meteor, interacting with the ionosphere, creates a cloud of reflecting ionisation suspended in the atmosphere and which can remain reflective for much longer. This has little Doppler shift, just that associated with the motion of the wind at that altitude. These are known as “Tail Echoes” and show on the waterfall display as sometimes broad and complex vertical lines. Fig 1 shows a classic meteor echo with a Head and a Tail. Many of the echoes seen by the radar are from small meteoroids no bigger than grains of sand and only produce a head echo. | 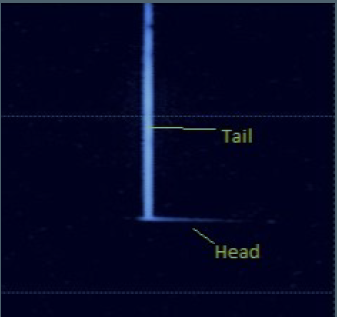 Fig 1 |
Fig 2 is a screenshot of the live display. It shows a number of “head echoes” from the receivers in the network. The faint vertical lines precisely at the centre are direct signals from the beacon and vary with radio propagation conditions. The near vertical, slightly curving lines, are aircraft echoes. The meteor “head echoes”, the near horizontal traces in Fig 2 have no “Tail echoes”.
Fig 2
Currently there are 5 receivers in the network at five different locations, see Fig 3. The beacon transmitter is located at the Sherwood Observatory near Mansfield Nottinghamshire, and illuminates a region with a diameter of more than 400km centred on the observatory.
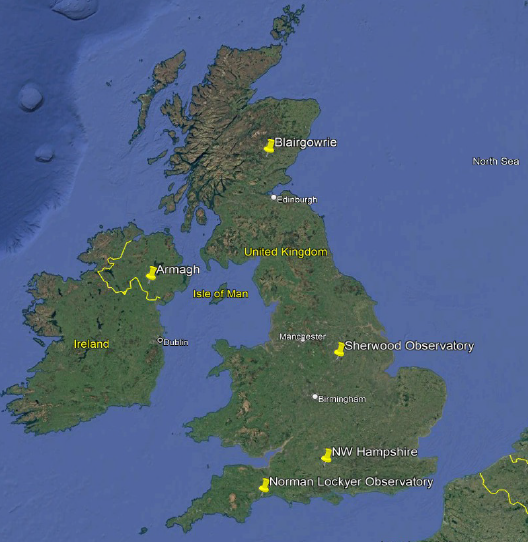 Fig 3 The UK Meteor Radar network |
Meteor echoes, especially small ones, are highly directional so in order to capture the maximum number of echoes and hence meteors, it is desirable to have receivers at multiple locations. Also, when larger meteors produce less directional echoes, observations from multiple directions may make it possible to triangulate the location and trajectory of the meteor using precise Doppler measurements. |
Observing meteors
The rate at which the system detects meteors averages at about two per minute. Most of these are very small, no bigger than grains of sand. But occasionally we see much bigger meteorites.
The best time to look for meteors is in the first part of the day from 00:00 to 12:00 local time when our location on the planet faces towards its' direction of travel in its' orbit around the sun and collisions with dust and rocks in space occur most frequently. Regular showers occur when the Earth passes through trails of dust left behind by comets and asteroids. The rate of observation of meteors might rise considerably when this happens. There are various on-line calendars giving the dates of the regular meteor showers. Meteor Shower Calendar.
Things to look out for when using the “Live” stream displays are brightness, Echo Radio Frequency and Doppler Shift using the horizontal scale. Note also the duration, spectral spread and frequency / Doppler shift of the tail echo when present.
Recognising meteors and other echoes
Meteor echoes are detectable to the radio horizon from the altitude where they create ionisation ( 80 to 100km) a distance of around 1200km. Echoes from aircraft flying at 10,000m are detectable to a distance of about 250km.
So receivers within about 400km of the transmitter will see aircraft echoes. These appear as near vertical, slightly curving lines such as those in Fig 4 which also shows a small meteor head echo, the bright near horizontal trace. The curvature of the aircraft echo displayed on the waterfall is due to its changing Doppler shift.
Fig 4
While the beacon transmitter beams vertically up, some energy travels horizontally to sometimes produce a “direct” signal at some receivers. On the Waterfall this will appear as a vertical line precisely on the beacon frequency of 50.408MHz. Fig 5
Fig 5
Sometimes two aircraft echoes or an aircraft echo and a direct signal will “beat” together to produce a pulsating effect. See Fig 6. This is known as aircraft flutter in communications terms and is not of interest to us when observing meteors or other events in the ionosphere.
Fig 6
To comply with its OFCOM licence requirements the beacon has to send its call sign GB3MBA every few minutes. It does this with high speed Morse code using A1A keying. If a strong direct signal or aircraft reflection is present this can produce a trace like that in Fig 7. This is not a meteor echo. These are known as key clicks. Ideally they would not be present. The systems' high resolution of frequency shows this modulation as expected.
Fig 7
Interference
Interference is the bane of all radio astronomers. We have tried to select radio quiet locations for our receivers. But cannot avoid all interference. Sometimes interference comes in bursts see Fig 8. The source could be man made or from lightning within a few hundred km. If you see single or multiple lines with more or less rapidly changing frequency they are likely to be from poorly designed electronic equipment nearby.
Fig 8
Other reflecting events in the ionosphere
Other phenomena including solar radiation, wind shear etc. can produce radio reflecting events in the ionosphere. Sporadic E and Aurora are examples.
Fig 9
Meteor Head echo Doppler
For the purposes of understanding head echo Doppler shift consider the meteor as a point source moving along it's trajectory but only being reflective to radio while its in the bold dotted red regions shown in Fig11 where ionisation is strong enough to support reflection of radio. In all cases the reflection path length is changing and the meteor is decelerating due to friction. Fig 10 is a simplified plan view in 2D. Altitude is not shown or implied .
Fig 10
In the case of meteor M2 ionisation starts while the reflection path length is reducing and ends with the path length increasing. So the Doppler starts positive at S, passes through zero and ends at E, negative . In the case of meteor M3, the path length from transmitter T to M3 and on to the receiver at R is increasing at S so the Doppler will be negative and increases towards the end of the ionisation E so the Doppler starts negative and becomes more negative. So although the slopes observed from different receivers in the network will vary, in all cases the slope of the head echoes will be from lower right towards upper left on the waterfall. Raw data from the receivers being is recorded for analysis in the future. This will enable the slopes to be studied in detail while embedded timing data will enable correlation of observations from the different receivers.
More on Tail echoes
Tail echoes occur when relatively static regions of the ionosphere become sufficiently ionised to reflect radio due to the passage of the meteor and remain ionised for a time after the meteor has passed through it. Tail echoes do not always form but when they do they can last for tens of seconds and sometimes longer. At the altitude where meteors burn up creating the head echo the Ionosphere is already more or less ionised .. the clue is in the name. But until triggered by the passage of a meteor or other events which may include wind shear, the electron density is not sufficient to reflect radio. As these ionised regions are relatively static in the ionosphere the reflections exhibit relatively little Doppler shift and what there is is due to the ionisation drifting in the wind. Meteorologists use this to measure wind speeds at this altitude which is too high for balloons, too low for satellites and too expensive to reach frequently with rockets !
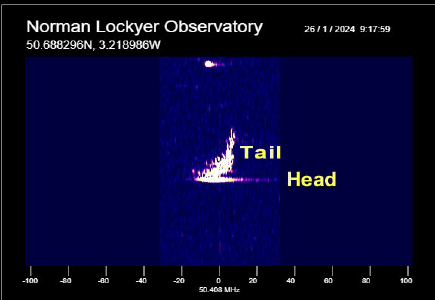 Fig 11 |
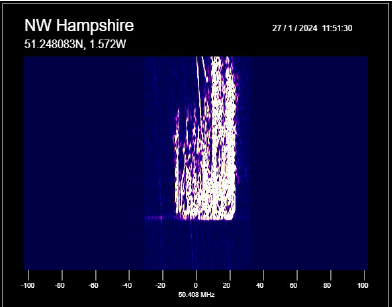 Fig 12 |
Fig 11 shows a head echo followed by a tail lasting a few seconds. While Fig 12 has no obvious head echo but the clearly defined straight, sloping bottom of the trace suggests a head echo. Observations have shown that head echoes are highly directional at the 6m wavelength. This is due to the ionisation causing them being cylindrical, even wire like with a diameter smaller than a half wavelength. Observations using cross polarised antennas demonstrate that tail echoes can sometimes be linearly polarised too. In Fig 13 the tail echo lasts more than 30 seconds. Note the wide spectral spread / range of Doppler shifts, suggesting the ionised region encompasses a range of wind speeds. Wind shear adding to the electron density ? Tail echoes viewed with this high resolution can be spectacular and have weird shapes that need explanation.
Exotic Echoes
From time to time you will see strange shaped echoes such as those in Fig 13 . Like head echoes these are sometimes directional and polarised. Maybe we can learn something of the state of the ionosphere from such echoes?
Fig 13 Some unusually shaped "Tail Echoes"
The future
We are now able to record the full bandwidth data from all the receivers in the network. At a sample rate of 7812.5 Samples per second and including precision timing data this allows correlation of observations from the different receiver locations with a precision of about 130uS. The recording archive can be found here
We are developing tools to allow users of the recorded data to scroll through the data to examine events of particular interest. We are also working on automated capture and analysis of events of interest.
If you would like to contribute to this work please make contact with the group Contact Us
